Last year, we shared our survey results in a static report, and we felt like we needed more. We wanted something digital, visual, and adjustable like your career. This year, we’re taking our insights further with a new digital compensation dashboard built from real data across our network. You will be able to analyze by title, fund size, and strategy to see exactly where you stand in the market.
What you’re seeing here is just a preview. More data, more insights, and more knowledge are coming soon. Take our survey today!
Frequently Asked Questions (FAQs)
If this is just a preview, what will I see in the full digital dashboard?
The full digital dashboard will unlock accurate, comprehensive, and confidential compensation data from our network, covering everything from firm type and assets under management to position-specific pay. As a member, you’ll be able to compare base, bonus, and total compensation now, with deeper insights added as more professionals contribute their data. In addition to the median, you’ll also see the top 25% and the bottom 25%, giving you a full picture of how compensation stacks up across the market.
How does your report define the various positions surveyed?
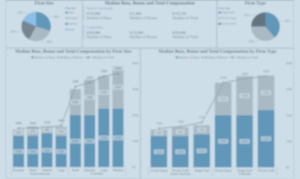
These definitions help standardize compensation comparisons across firms and ensure clarity when benchmarking your career level. In the preview above, you will see the two roles defined generally as Senior Associate: 4 to 7 years of experience & Controller: 10 to 15 years of experience. In the dashboard for members, you will see various other titles, including but not limited to: Associate, Assistant Controller, Senior Controller, etc.
I earn more or less than the figures shown. What does the median represent?
The median compensation shown above represents the midpoint of reported salaries from 2023 and 2024, meaning half of professionals earn more, and half earn less. While it serves as a strong benchmark for understanding market norms, individual compensation will naturally vary depending on factors such as firm AUM, strategy, years of experience, certifications, and overall professional acumen at each level.
As we collect more data from our members, we’ll also be incorporating additional data analysis, such as the top 25% and bottom 25% of compensation, to provide an even clearer picture of the full range across the market.
As we collect more data from our members, we’ll also be incorporating additional data analysis, such as the top 25% and bottom 25% of compensation, to provide an even clearer picture of the full range across the market.
As a client of JSB Partners, can I access more detailed data?
Yes. JSB Partners offers specialized reports and deeper insights tailored to your organization and comprised of your direct competitors. We can analyze data in a variety of ways to fit your firm's unique needs, bespoke, rigorous, and strategically designed to support critical decision-making. For example, you can request reports segmented by firm strategy, AUM, or experience level, or take a closer look into CFO-level compensation data.
Contact our Market Knowledge team at yourexpert@jsbpartners.com for personalized support.
Contact our Market Knowledge team at yourexpert@jsbpartners.com for personalized support.